

When we talk about the characteristics of a wireless link, there are several factors that dominate any conversation: line of sight (or lack thereof), interference, and distance. We’ve talked about line of sight in other blogs here, but it’s worth going back and diving into this a bit deeper. It’s easy to say non-line-of-sight (NLoS) is important. But how important is it, really?
As it turns out, very, because true line of sight is only available for a fraction of residential homes.
While theoretical knowledge is all well and good, nothing beats knowledge gained from real-world conditions. In order to obtain this type of information, we did a survey of 20 different residential deployment scenarios across the US looking specifically at the feasibility of line of sight links.
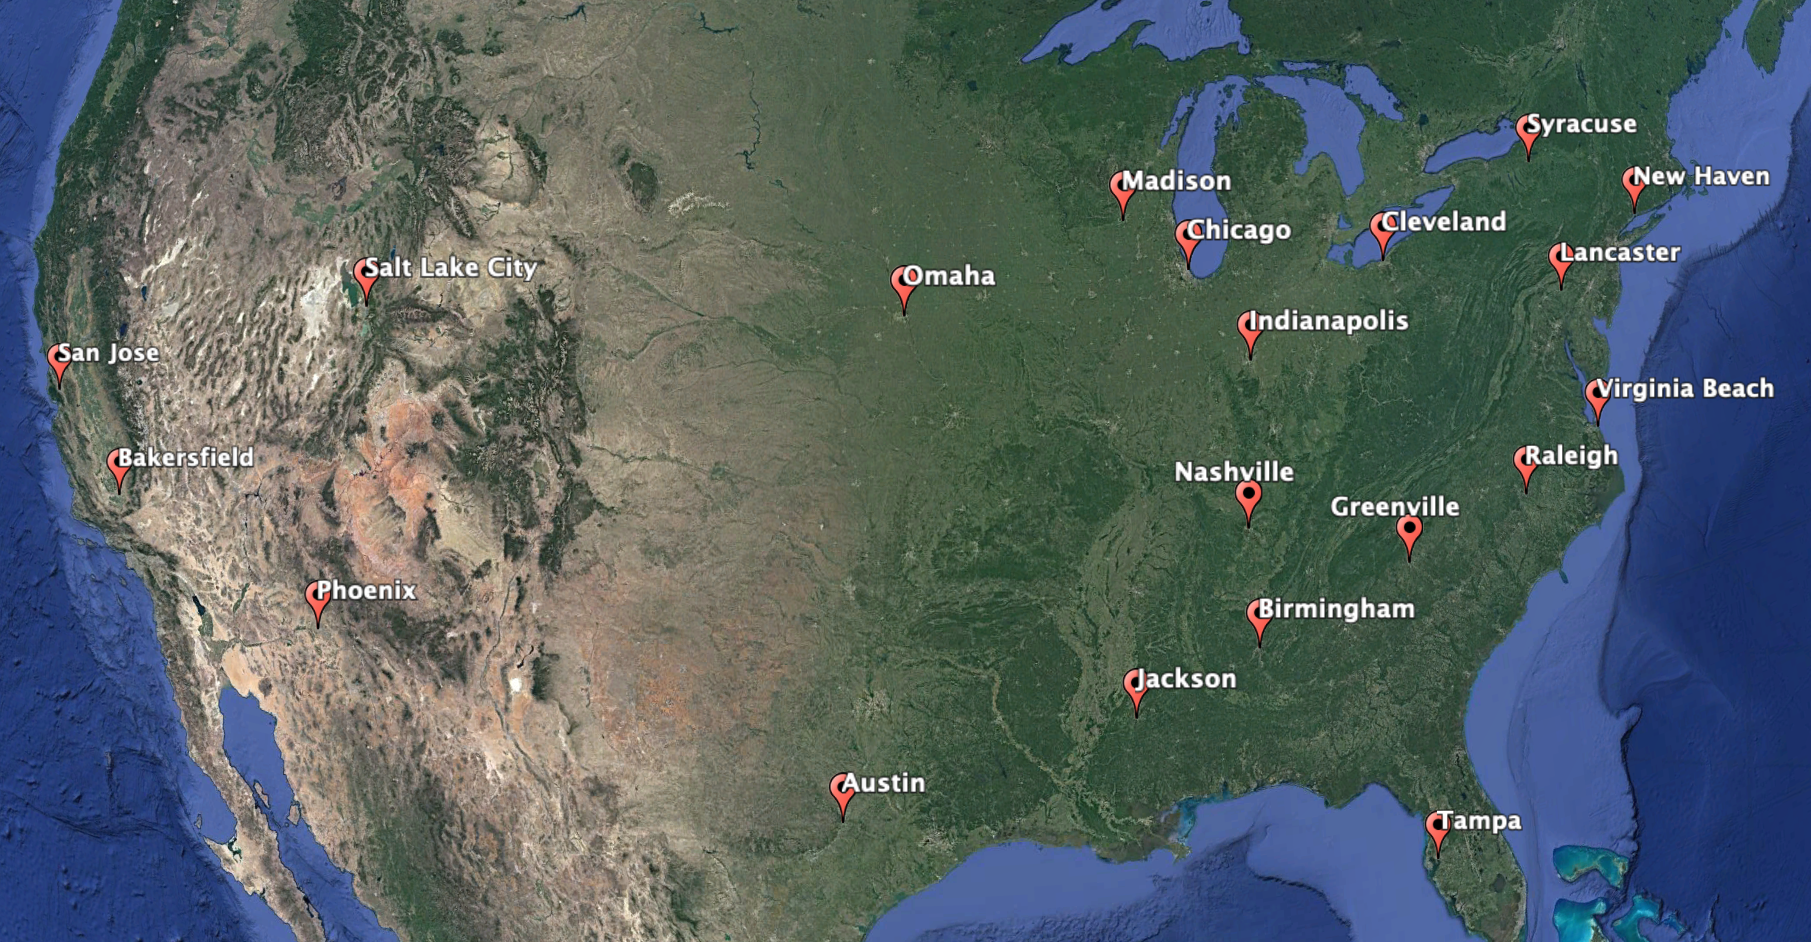
Figure 1: 20 randomly selected US residential markets
What We Studied
Within each metropolitan area, 4 random lat/long pairs were generated and, from these four, the most residential pair was chosen for link feasibility analysis. A 90° sector layout is assumed with a coverage radius of 500 m.
For the feasibility study, we used Google Earth which offers a rich set of 3D building and foliage data that are crucial for this determination. To get an understanding of how many homes have real line of sight, we set Google’s camera height to 10, 15, and 20 m heights and counted the number of buildings visible at each height as well as the specific visibility, i.e., line of sight to a window, roof, or eave.
An example is shown below for Madison, WI for both the 90° coverage area and a street (height) view.
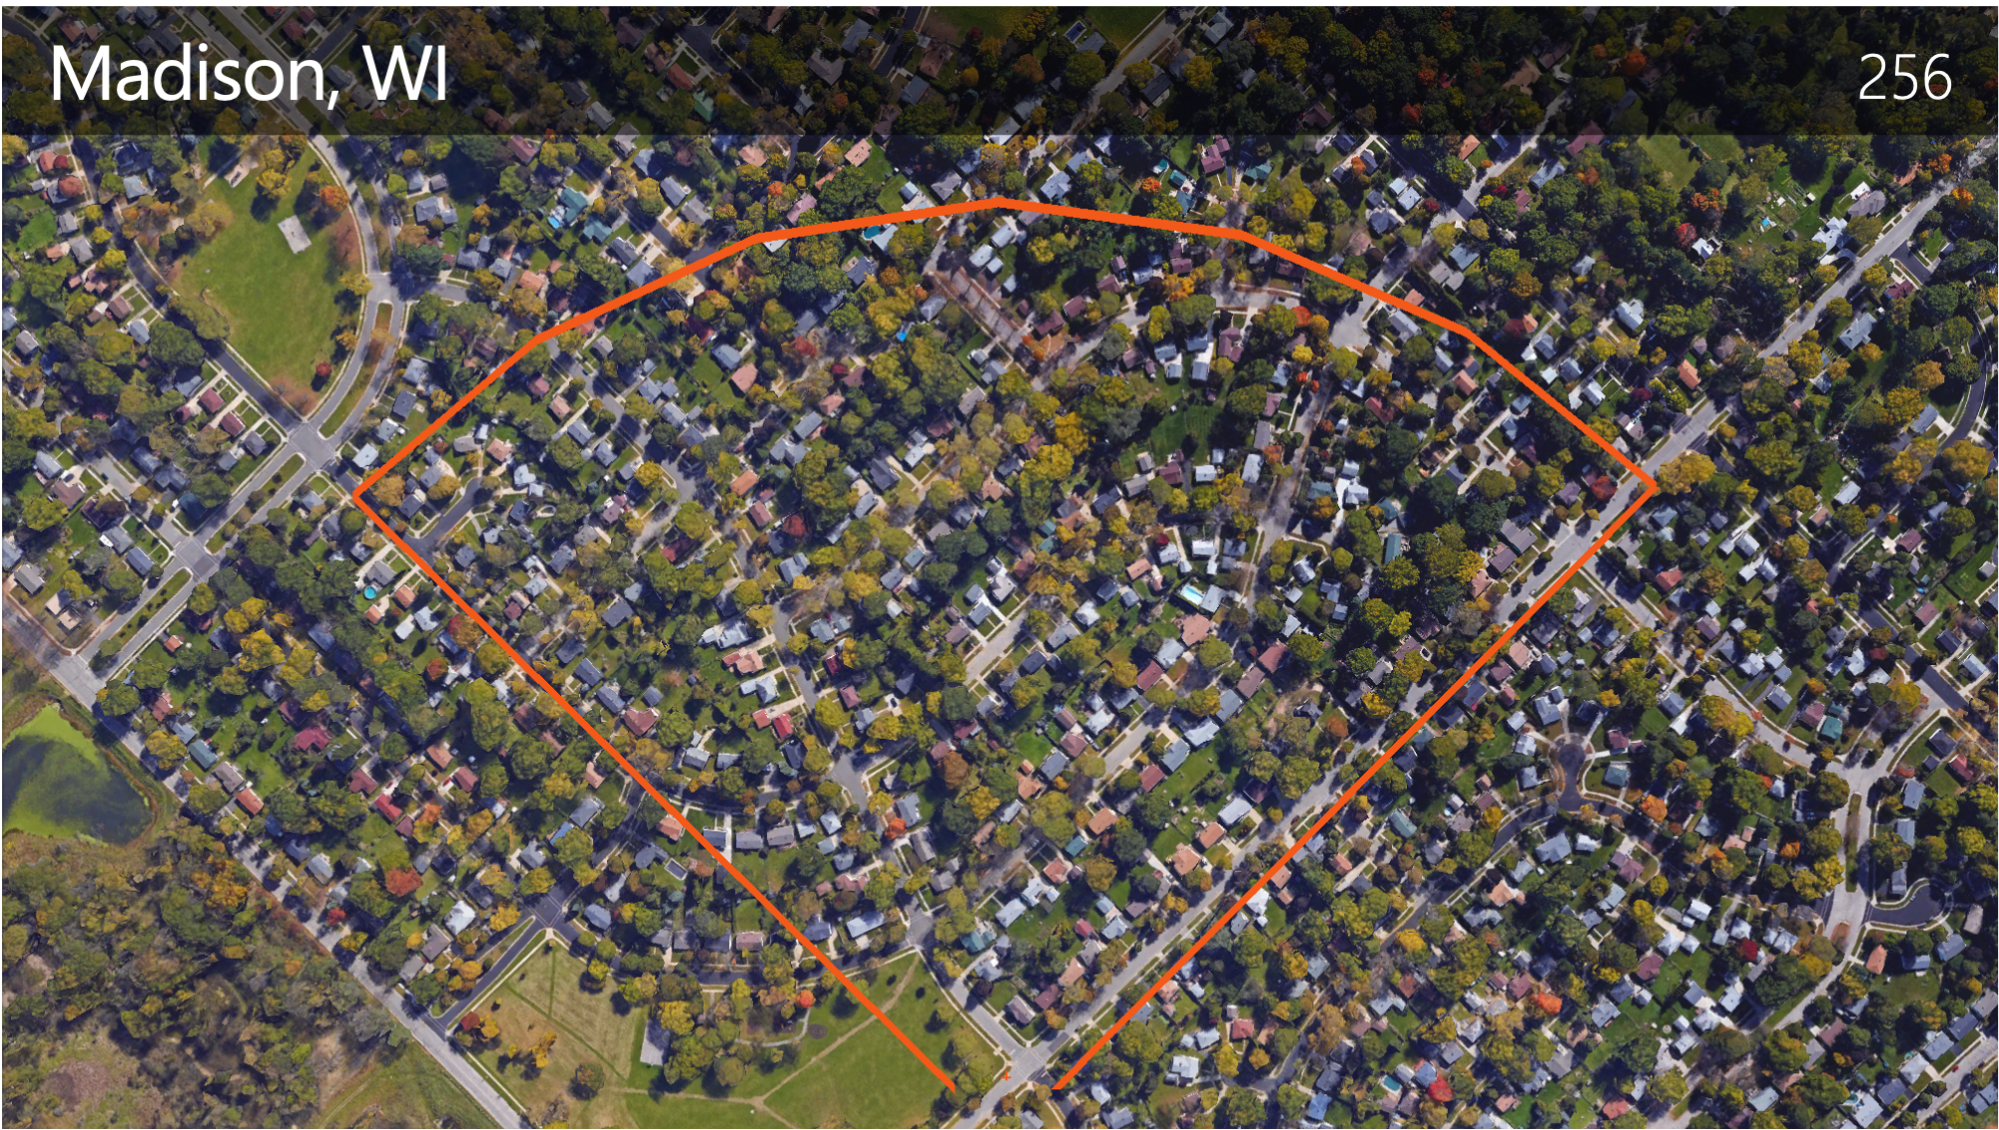
Figure 2: 256 homes covered by 90° sector
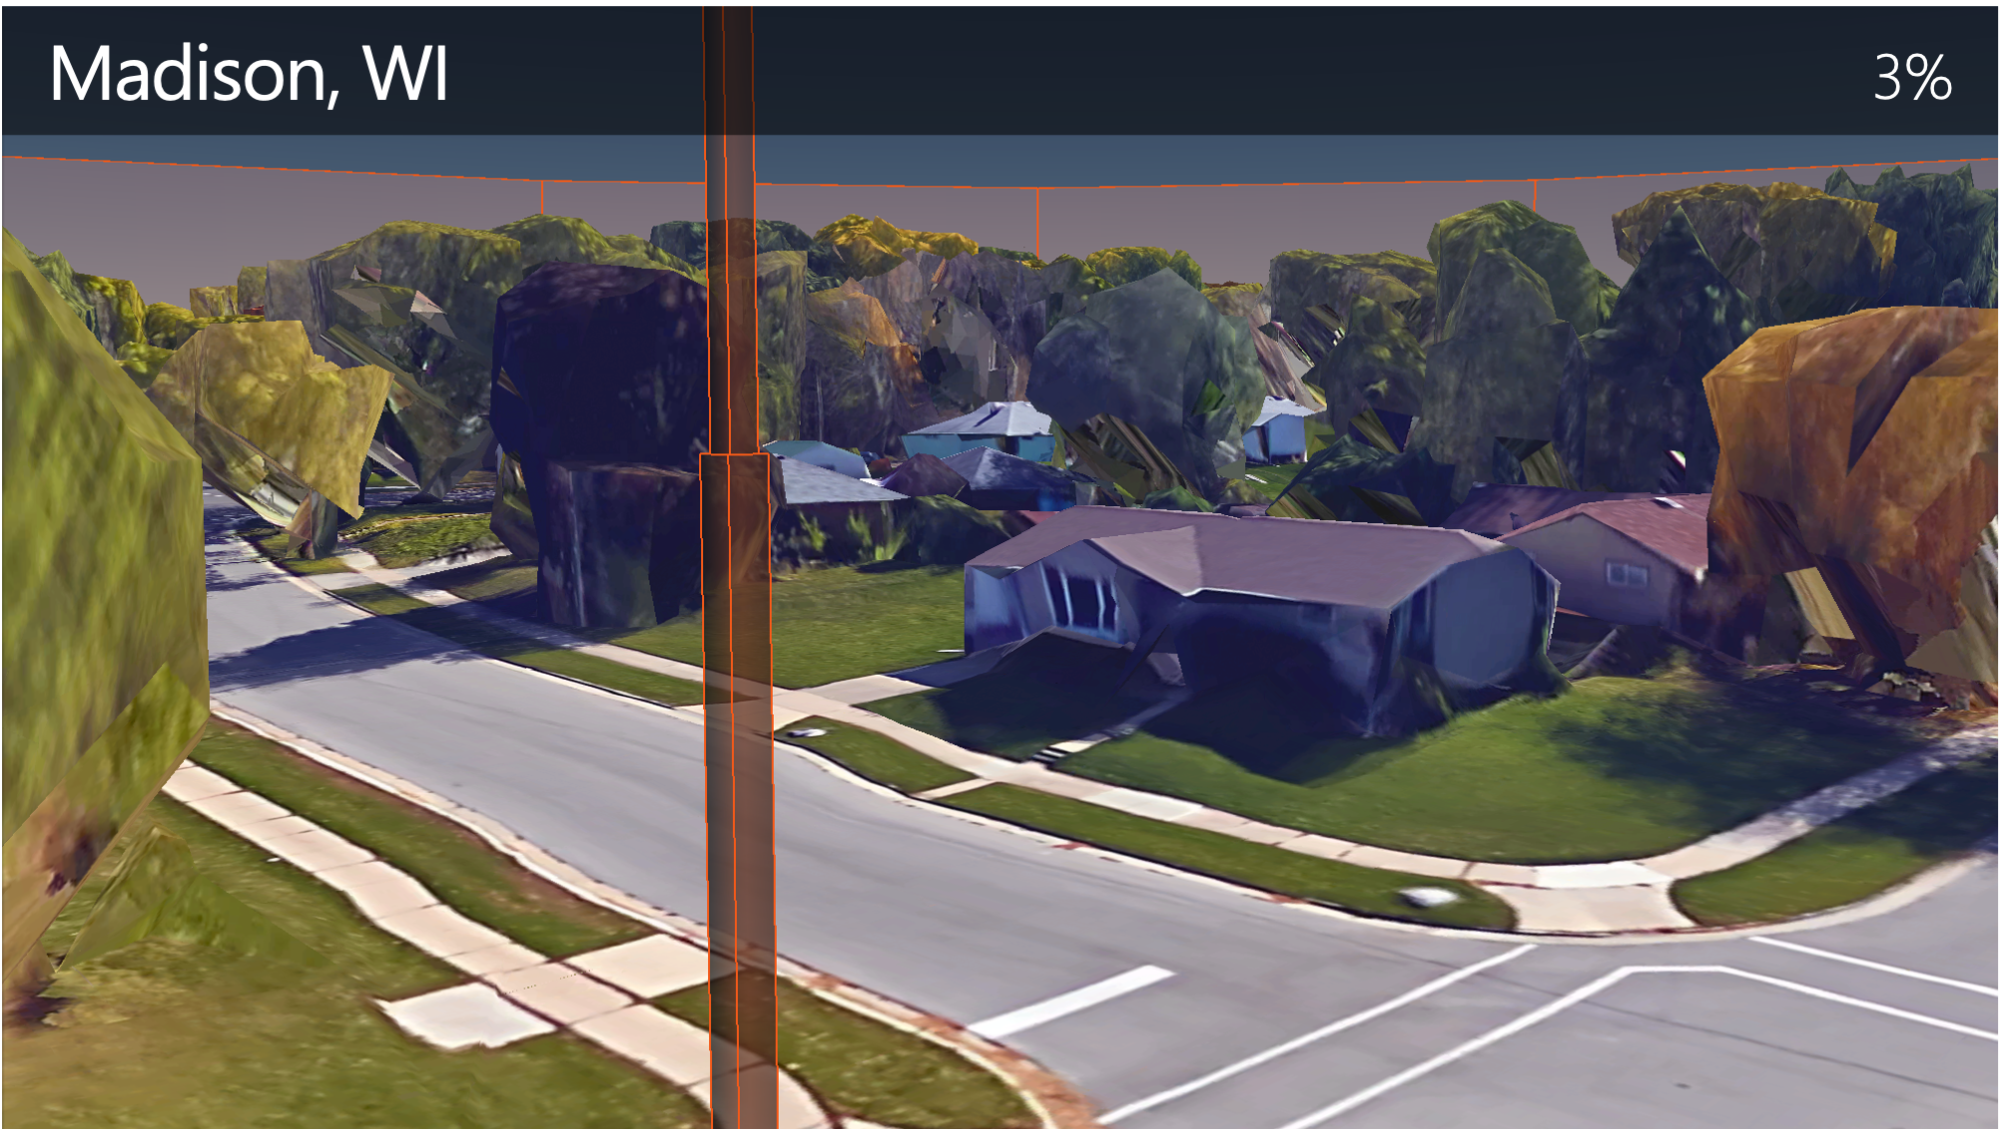
Figure 3: Street view showing 3% line of sight link probability for the selected area
The Results
As the figures above hint at, the probability of a line of sight link is low across all markets. The graph below summarizes the data for all 20 metro areas. Each circle represents a single deployment. The circles with heavier lines represent the average of 20 deployments for a given CPE height.
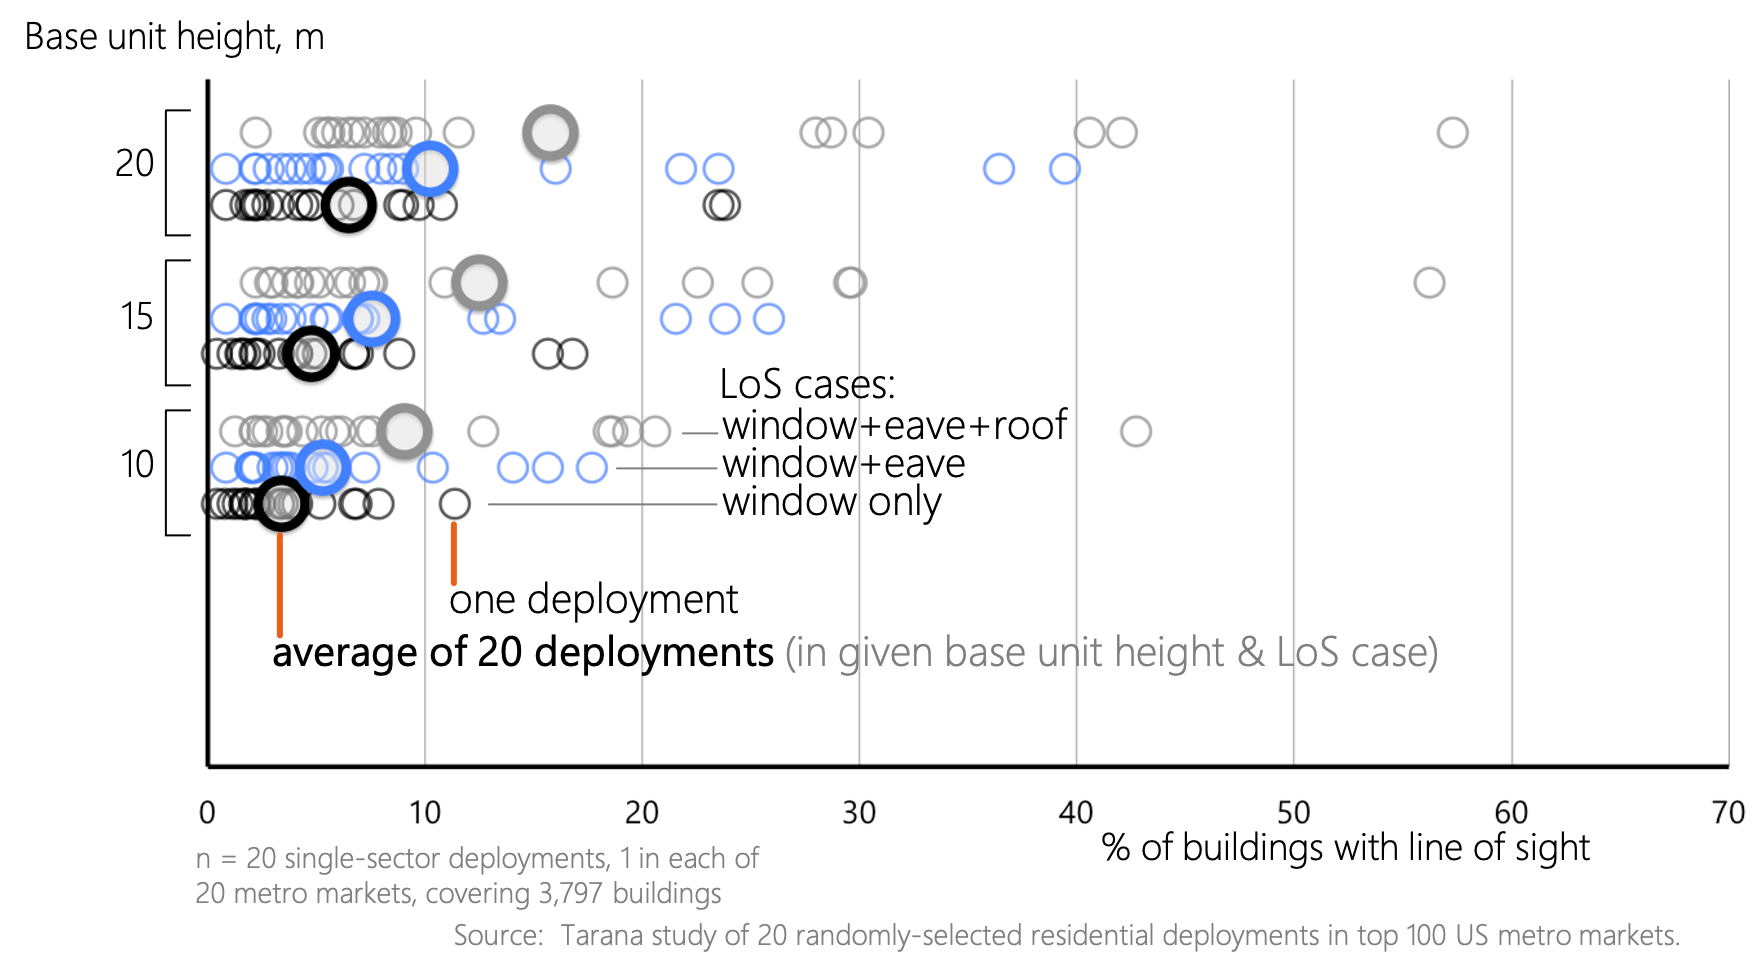
As the graph above shows, the majority of deployment locations have roughly 10% or less of the buildings with a clear line of sight at any chosen height. Therefore, operators who want to deploy in these locations (or similar locales) need a good solution for handling non-line-of-sight (NLoS). Without this, they will be unable to serve the majority of households.
NLoS is a critical factor in the success of a fixed-wireless access network. If an operator is limited to line of sight only, the vast majority of these locations cannot be serviced. Legacy FWA vendors optimize for LoS operation but, as the graph shows, that will only be feasible in relatively few cases. Of course you can always try to get near-line-of-sight with legacy FWA equipment but chances are the link will be of poor quality.
The graph is an excellent visualization of why we spent so much time perfecting G1 and its ability to get around obstructions in non-line-of-sight conditions. With G1, operators can service more customers in larger areas and at higher speeds and scale. We do this through perfect multipath integration in near- and non-line-of-sight conditions with intelligence at both ends of the link (tower and CPE).
To learn more about how G1 produces its incredible results, check out our blog where we dive into more detail about getting around obstacles.
If you just can’t wait to learn more, check out our other blogs or some of our favorite customer links. Or reach out to us at info@taranawireless.com. We’d love to hear from you.